Mission Control Jobs: Solid Queue Ops Setup
Mount mission_control-jobs for Solid Queue, secure the dashboard, filter job arguments, add alerting outside the UI, and rehearse the retry path.
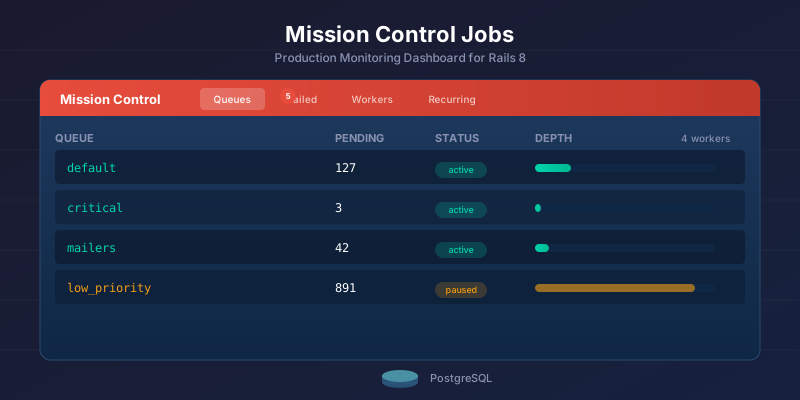
The first time a Solid Queue job failed in a real app, the missing piece was not another worker. It was a place to answer simple questions without opening a Rails console first: which queue is stuck, what arguments did the failed job receive, can I retry only the jobs with the fixed class, and are workers still checking in?
Mission Control Jobs gives you that view. It is a mountable Rails engine for inspecting queues, retrying or discarding failed jobs, pausing work, and watching worker processes. It does not replace alerting or historical metrics, so the useful setup goes past "mount the dashboard." Mount it, lock it down, filter sensitive arguments, and add the alerts it does not send.
If you've already set up Solid Queue or migrated from Sidekiq, Mission Control is the next operational step. This guide covers the parts that matter once jobs are real: authentication, the console API, argument filtering, retention, and alerting.
Version note: the Mission Control Jobs README documents manual gem installation plus a route mount, HTTP Basic Auth closed by default, bin/rails mission_control:jobs:authentication:configure, filter_arguments, and internal_query_count_limit. Its gemspec lists Solid Queue 1.0.1 as a development dependency rather than a hard runtime minimum, so pair it with a current Solid Queue release.
Where Mission Control fits
Mission Control provides free queue management with built-in multi-app support and a console API for bulk operations. Sidekiq Pro offers better real-time metrics and throughput graphs. GoodJob's dashboard sits between them, with decent charting at no cost. The full comparison:
| Feature | Mission Control | Sidekiq Web UI | GoodJob Dashboard |
|---|---|---|---|
| Price | Free gem | Free UI; paid features in Pro/Enterprise | Free gem |
| Queue browsing | Yes | Yes | Yes |
| Pause/unpause queues | Yes | Yes (Pro) | No |
| Failed job retry | Individual + bulk | Individual + bulk | Individual + bulk |
| Job argument inspection | Yes (with filtering) | Yes | Yes |
| Worker monitoring | Yes | Yes | Yes |
| Real-time metrics | No | Yes (Pro) | Yes (charts) |
| Throughput graphs | No | Yes (Pro) | Yes |
| Job search/filter | By queue + class | By queue + class + args | By queue + class + args |
| Recurring job management | View only | Via sidekiq-cron | Full CRUD |
| Console API | Bulk queue operations | Limited | ActiveRecord queries |
| Multi-app support | Yes (built-in) | No | No |
| Sensitive arg filtering | Built-in config | Manual | Manual |
| Authentication | HTTP Basic + custom | Rack middleware | Rack middleware |
The competitor cells reflect each tool's tiers as documented at the time of writing (Sidekiq queue pausing, for instance, is a paid-tier feature); confirm against the vendor's current docs before relying on a specific row. The dashboard choice usually follows the backend choice. If you're still deciding between Solid Queue and Sidekiq, the Solid Queue setup guide covers the trade-offs in detail.
Installation
There is no mission_control:jobs:install generator - unlike Devise, it has nothing to scaffold. Setup is three manual steps: add the gem, mount the engine, then lock it down.
# 1. Gemfile - then run: bundle install
gem "mission_control-jobs"
# 2. config/routes.rb - mount the engine at /jobs
Rails.application.routes.draw do
  mount MissionControl::Jobs::Engine, at: "/jobs"
end
# 3. Secure it - generate HTTP Basic Auth credentials
bin/rails mission_control:jobs:authentication:configure
That gives you a working, password-protected dashboard at /jobs, reading straight from your Solid Queue tables - no migrations, no separate database, no Redis, nothing extra to operate. The version note above covers the Solid Queue dependency; the sections below expand session-based auth, the console API, and alerting.
Asset Pipeline Note
If you're using Vite, jsbundling, or an API-only Rails app, you also need Propshaft for Mission Control's assets:
# Gemfile - only needed if you don't already have an asset pipeline
gem "propshaft"
Then precompile before deploy:
RAILS_ENV=production rails assets:precompile
Most standard Rails 8 apps with Propshaft (the new default) won't need this extra step.
Authentication
Mission Control ships locked down by default - no credentials configured means no access. Choose HTTP Basic Auth for simplicity, or point it at your existing Rails 8 authentication or Devise setup for session-based access control.
HTTP Basic auth: enough for a solo admin
Generate credentials with the built-in task:
# Development
bin/rails mission_control:jobs:authentication:configure

# Deployed environment
RAILS_ENV=production bin/rails mission_control:jobs:authentication:configure
This stores credentials in Rails encrypted credentials:
# config/credentials.yml.enc (after decryption)
mission_control:
  http_basic_auth_user: admin
  http_basic_auth_password: your-secure-password
Or set them manually in an initializer:
# config/initializers/mission_control.rb
Rails.application.configure do
  config.mission_control.jobs.http_basic_auth_user = Rails.application.credentials.dig(:mission_control, :http_basic_auth_user)
  config.mission_control.jobs.http_basic_auth_password = Rails.application.credentials.dig(:mission_control, :http_basic_auth_password)
end
HTTP Basic Auth works fine for small teams and solo developers. It's what I use on most projects where I'm the only one checking the dashboard.
Session-based auth through your own user model
For a real deployed app, reuse the authentication you already have. Rails 8 ships an authentication generator; point Mission Control at a controller that runs the same check, so admins log in through your normal flow and the dashboard inherits the session you already trust:
# app/controllers/admin_controller.rb
class AdminController < ApplicationController
  before_action :require_admin

  private

  def require_admin
    # Use Rails 8 authentication
    redirect_to root_path unless authenticated? && Current.user.admin?
  end
end
# config/environments/production.rb
config.mission_control.jobs.base_controller_class = "AdminController"
config.mission_control.jobs.http_basic_auth_enabled = false
Devise is the same wiring with different method names: swap the before_action for authenticate_user! and check current_user.admin? instead of Current.user. The base_controller_class line is what makes Mission Control run your controller's filters before it renders anything.
Locking the dashboard to an IP range
For internet-facing dashboards, consider adding IP restrictions on top of authentication:
# app/controllers/admin_controller.rb
class AdminController < ApplicationController
  before_action :restrict_ip
  before_action :authenticate_user!

  private

  def restrict_ip
    allowed_ips = ENV.fetch("ADMIN_ALLOWED_IPS", "").split(",")
    unless allowed_ips.empty? || allowed_ips.include?(request.remote_ip)
      head :forbidden
    end
  end
end
What the Dashboard Shows You
Mission Control provides four views at /jobs: Queues, Failed Jobs, In-Progress Jobs, and Workers. The features available depend on the Active Job adapter; the useful Solid Queue path is usually failed jobs first, then queue depth, then worker status.
During an incident I would inspect in this order:
- Failed Jobs: confirm whether one job class or queue is responsible.
- A sample failed job: check the exception, backtrace, and filtered arguments.
- Queues: decide whether to pause noisy work before deploying a fix.
- Workers: confirm jobs are still being picked up after the deploy.
- Console API: retry only the fixed class, not the whole failed set.
The tabs below are reference material for that path, not separate monitoring by themselves.
Queues Tab
Lists all your Solid Queue queues with pending job counts. You can:
- See how many jobs are waiting in each queue
- Pause a queue (stops workers from picking up new jobs)
- Unpause a queue (resumes processing)
- Click into a queue to browse individual pending jobs
Queue pausing is the feature I use most during deployments. Pause the queue, deploy, verify the new code works, then unpause. No jobs lost, no race conditions.
Failed Jobs Tab
Shows every job that raised an unhandled exception. For each failed job you see:
- Job class name
- Queue it was running on
- Error class and message
- Full backtrace (with Rails backtrace cleaning)
- Job arguments (with optional filtering for sensitive data)
- When it failed
You can retry individual jobs or select multiple jobs for bulk retry/discard.
In-Progress and Workers
The In-Progress view shows jobs executing right now, which is how you spot a stuck long-runner or a single job class monopolizing every worker. The Workers view lists each active Solid Queue process with its PID, hostname, queue assignments, and current job, so you can confirm the fleet you expect is actually checking in.
The Console API
Mission Control extends ActiveJob with a query interface you can use in the Rails console to filter, retry, and discard jobs in bulk. Run ActiveJob.jobs.failed.where(job_class_name: "SomeJob").retry_all to retry thousands of failed jobs in one command. The web dashboard covers the day-to-day; the console API is what you reach for during an incident, when the failed jobs number in the thousands and clicking through a UI stops being an option.
Start a Rails console and you get immediate access:
bin/rails console
# => Type 'jobs_help' to see available servers
Querying Jobs
# All failed jobs
ActiveJob.jobs.failed
# => Returns a relation-like object you can chain

# Failed jobs for a specific class
ActiveJob.jobs.failed.where(job_class_name: "PaymentProcessorJob")

# Pending jobs in a specific queue
ActiveJob.jobs.pending.where(queue_name: "critical")

# Scheduled jobs (waiting for their run time)
ActiveJob.jobs.scheduled

# Currently executing jobs
ActiveJob.jobs.in_progress

# Finished jobs (if you have Solid Queue's finished job retention enabled)
ActiveJob.jobs.finished

# Pagination
ActiveJob.jobs.failed.limit(10).offset(0)
Bulk Operations
This is where the console API saves you during incidents:
# Retry ALL failed jobs
ActiveJob.jobs.failed.retry_all

# Retry only failed jobs of a specific class
ActiveJob.jobs.failed.where(job_class_name: "EmailDeliveryJob").retry_all

# Discard all failed jobs in a queue (they're not coming back)
ActiveJob.jobs.failed.where(queue_name: "low_priority").discard_all

# Discard pending jobs of a specific class
# Useful when you deployed a broken job and need to clear the queue
ActiveJob.jobs.pending.where(job_class_name: "BrokenJob").discard_all
For large bulk operations, add a delay between batches to avoid hammering your database:
# Process in batches with a 2-second pause between each
MissionControl::Jobs.delay_between_bulk_operation_batches = 2.seconds
ActiveJob.jobs.failed.retry_all
Incident Example
Say you deployed a change that broke OrderSyncJob, and thousands of jobs failed before anyone noticed. The recovery:
# 1. See the damage
ActiveJob.jobs.failed.where(job_class_name: "OrderSyncJob").count
# => 3,847

# 2. Check a sample to confirm it's the same error
ActiveJob.jobs.failed.where(job_class_name: "OrderSyncJob").limit(5).each do |job|
  puts "#{job.job_id}: #{job.error.message}"
end

# 3. Deploy the fix first, then retry in batches
MissionControl::Jobs.delay_between_bulk_operation_batches = 3.seconds
ActiveJob.jobs.failed.where(job_class_name: "OrderSyncJob").retry_all
# => Jobs retry in batches of 1000 with 3-second pauses
Filtering Sensitive Arguments
Mission Control filters sensitive job arguments (API keys, tokens, PII) using the same pattern as Rails parameter filtering. Configure filter_arguments in an initializer and matching keys show as [FILTERED] in both the web UI and console output:
# config/initializers/mission_control.rb
Rails.application.configure do
  config.mission_control.jobs.filter_arguments = [
    :password,
    :token,
    :api_key,
    :secret,
    :ssn,
    :credit_card
  ]
end
Building Alerting Around Mission Control
Mission Control does not send alerts - it is a dashboard, not a monitoring system. Alerting is separate work, and where you put it depends on what you already run: an error tracker you already pay for, an uptime monitor that can hit an endpoint, or Solid Queue itself.
Let your error tracker do the alerting
If you already run Sentry, Honeybadger, or Bugsnag, the cheapest path is to route job failures there and reuse the alerting you already configured:
# app/jobs/application_job.rb
class ApplicationJob < ActiveJob::Base
  # Solid Queue doesn't auto-retry, so this is your retry policy.
  # report: true (Rails 7.2+) sends each failure to Rails.error, and the
  # job still lands in solid_queue_failed_executions after the last attempt.
  retry_on StandardError,
           wait: :polynomially_longer,
           attempts: 3,
           report: true
end
Do not pair that retry_on with a discard_on StandardError in the same class as a "report after retries exhausted" hook. ActiveSupport::Rescuable searches handlers in reverse declaration order - "the most recently declared is the highest priority match" - so the discard_on wins, the job is discarded on its first failure, attempts: 3 never runs, and nothing reaches the Failed tab you mounted this dashboard to read.
Your error tracker already has alerting, PagerDuty integration, and deduplication. Use what you have.
A health endpoint your uptime monitor can poll
Add a health check that monitoring tools can poll:
# app/controllers/health_controller.rb
class HealthController < ApplicationController
  # GET /health/jobs
  def jobs
    checks = {
      failed_jobs: SolidQueue::FailedExecution.count,
      blocked_jobs: SolidQueue::BlockedExecution.count,
      oldest_pending: SolidQueue::ReadyExecution.minimum(:created_at),
      workers_active: SolidQueue::Process.where(kind: "Worker").count
    }

    # Alert if too many failures or queue is backing up
    healthy = checks[:failed_jobs] < 100 &&
              checks[:workers_active] > 0 &&
              (checks[:oldest_pending].nil? || checks[:oldest_pending] > 10.minutes.ago)

    render json: checks.merge(healthy: healthy),
           status: healthy ? :ok : :service_unavailable
  end
end
Point your uptime monitor (Pingdom, UptimeRobot, or even a simple cron curl) at this endpoint. A 503 response triggers your alert.
A recurring job that watches its own queue
Use Solid Queue's own recurring jobs to monitor itself:
# app/jobs/queue_health_check_job.rb
class QueueHealthCheckJob < ApplicationJob
  queue_as :monitoring

  def perform
    failed_count = SolidQueue::FailedExecution.count
    oldest_pending = SolidQueue::ReadyExecution.minimum(:created_at)

    if failed_count > 50
      AdminMailer.job_alert(
        subject: "#{failed_count} failed jobs in queue",
        details: failed_job_summary
      ).deliver_now  # deliver_now, not deliver_later!
    end

    if oldest_pending && oldest_pending < 15.minutes.ago
      AdminMailer.job_alert(
        subject: "Job queue backing up - oldest job #{time_ago_in_words(oldest_pending)} old",
        details: queue_depth_summary
      ).deliver_now
    end
  end

  private

  def failed_job_summary
    SolidQueue::FailedExecution
      .joins(:job)
      .group("solid_queue_jobs.class_name")
      .count
      .sort_by { |_, count| -count }
      .first(10)
      .map { |klass, count| "#{klass}: #{count}" }
      .join("\n")
  end

  def queue_depth_summary
    SolidQueue::ReadyExecution
      .joins(:job)
      .group("solid_queue_jobs.queue_name")
      .count
      .map { |queue, count| "#{queue}: #{count} pending" }
      .join("\n")
  end
end
# config/recurring.yml
queue_health_check:
  class: QueueHealthCheckJob
  schedule: every 5 minutes
Notice deliver_now instead of deliver_later - if your job queue is the thing that's broken, you don't want to enqueue another job to send the alert.
Configuration Reference
Tune internal_query_count_limit first - it prevents slow dashboard loads on large job tables by capping count queries. Here are all the Mission Control settings worth configuring for busy queues:
# config/initializers/mission_control.rb
Rails.application.configure do
  # Authentication
  config.mission_control.jobs.http_basic_auth_enabled = true
  config.mission_control.jobs.base_controller_class = "AdminController"

  # Filter sensitive job arguments from the UI
  config.mission_control.jobs.filter_arguments = [:password, :token, :api_key]

  # Limit count queries to prevent slow page loads on large tables
  # Default: 500,000 - lower this if your dashboard is slow
  config.mission_control.jobs.internal_query_count_limit = 100_000

  # Mark scheduled jobs as "delayed" after this threshold
  # Default: 1 minute
  config.mission_control.jobs.scheduled_job_delay_threshold = 5.minutes

  # Batch size for queries and bulk operations
  # Default: 1000
  config.active_job.default_page_size = 1000

  # Delay between bulk operation batches (retry_all, discard_all)
  # Default: 0 (no delay) - increase for large bulk ops
  config.mission_control.jobs.delay_between_bulk_operation_batches = 0
end
Performance Tuning
The internal_query_count_limit setting matters most on large job tables. Mission Control runs count queries on your job tables to show queue depths. With millions of rows, these queries get slow. The default cap of 500,000 means Mission Control shows "500,000+" instead of running a full table scan.
If your dashboard loads slowly, lower this:
config.mission_control.jobs.internal_query_count_limit = 50_000
Multi-App Monitoring
Mission Control can monitor multiple applications or adapters from one dashboard. Its README shows this through MissionControl::Jobs.applications.add, where each app name maps to one or more named queue adapters. Keep this as an advanced setup: for a normal Rails app, the default single app and configured active_job.queue_adapter is enough.
# config/initializers/mission_control.rb

queue_adapters_by_name = {
  solid_queue: ActiveJob::QueueAdapters.lookup(:solid_queue).new
}

MissionControl::Jobs.applications.add("main_app", queue_adapters_by_name)
Deployment Checklist
Complete these items before enabling Mission Control:
- Authentication configured (not using default empty credentials)
filter_argumentsset for any sensitive job data (tokens, PII, API keys)internal_query_count_limittuned if you have large job tables- Alerting configured separately (error tracker, health check, or monitoring job)
- IP restrictions considered for the
/jobsroute scheduled_job_delay_thresholdset to match your SLA expectations- Tested bulk retry/discard in staging before an incident
Trade-offs and Limitations
Mission Control is an inspection and recovery tool, not a monitoring system. It answers "what failed and can I retry it" very well, and "how is the queue trending" only in the present tense: there is no history and there are no percentiles.
What Mission Control Does Well
- Reads straight from your Solid Queue tables, so there are no migrations, no extra datastore, and no separate metrics pipeline to run
- Console API that handles incident-scale bulk retry and discard
- Multi-app support out of the box
- Argument filtering for compliance
What It Lacks
- No real-time metrics - you can't see throughput trends, processing times, or queue depth over time. Sidekiq Pro's real-time dashboard is significantly better for performance tuning.
- No alerting - it's purely reactive. You need to build alerting separately.
- No job search by arguments - you can filter by queue and class, but not by specific argument values. Investigating "what happened to user 12345's job" requires the console.
- No historical data - once a job is processed and cleaned up, it's gone from Mission Control. There's no retention or historical view unless you configure Solid Queue to keep finished jobs.
- Limited recurring job management - you can view recurring jobs but can't create, edit, or toggle them from the UI. Changes require editing
recurring.ymland redeploying.
The historical-data gap is the one you can actually narrow without leaving the box. Solid Queue keeps finished jobs by default, but only for a day - widen that window and Mission Control's "Finished" view (and ActiveJob.jobs.finished in the console) becomes a real audit trail instead of an empty list:
# config/application.rb (or an environment file)
config.solid_queue.preserve_finished_jobs = true     # default: true
config.solid_queue.clear_finished_jobs_after = 14.days  # default: 1.day
Solid Queue runs an hourly recurring job that deletes finished rows older than clear_finished_jobs_after in batches, so a longer retention window costs you table size, not latency on the enqueue path. Don't stretch it to months on a high-throughput app: solid_queue_jobs grows with every completed job, and that's the same table Mission Control's count queries scan - which is exactly why you also tune internal_query_count_limit. Two weeks is usually enough to answer "did this job run last Tuesday" without bloating the table.
When Mission Control Is Not Enough
If you need real-time performance dashboards, consider pairing Mission Control with:
- Application Performance Monitoring (Datadog, New Relic, Scout) for throughput metrics and latency tracking
- Error tracking (Sentry, Honeybadger) for job failure alerting and investigation
- Custom dashboards (Grafana + PostgreSQL queries) for historical job metrics
Mission Control handles the "what's happening right now" and "fix this broken job" workflows. APM handles "how is our job system performing over time."
The setup I would ship
I would mount Mission Control for any Solid Queue app where failed jobs matter, but I would not treat the dashboard as monitoring by itself. My baseline setup is:
- Mount it behind admin authentication, not a public route with basic auth credentials nobody rotates.
- Filter job arguments before the first support ticket, because failed payment, CRM, and accounting jobs tend to carry customer identifiers.
- Keep finished jobs long enough to answer recent operational questions, then let Solid Queue clean them up.
- Add alerting outside Mission Control, usually through the error tracker plus a small queue-depth health check.
- Practice bulk retry in staging, because the first incident is a bad time to learn the console API.
The incident path I would test is simple: make a job fail with a realistic argument shape, confirm the token or customer identifier is filtered in the dashboard, confirm the error tracker alerts without needing the dashboard open, deploy a fix, and retry only that job class from the console. If any step requires guessing in production, the dashboard is mounted but the operating process is not ready.
That is the right size of tooling for most Solid Queue deployments. If you need throughput graphs, latency percentiles, and long historical trends, pair it with APM or a database-backed dashboard. If you only need to see what failed and recover cleanly, Mission Control is enough.
Further Reading
- Mission Control Jobs on GitHub
- Solid Queue in Rails 8: Setup Notes and Trade-offs
- Sidekiq to Solid Queue Migration: Rails Runbook
- Deploy Rails 8 with Kamal to a VPS: Setup Runbook
- Solid Cache in Rails 8: When the Database Is the Right Cache
- Rails PostgreSQL Performance: Start With the Query Plan - tuning the database your jobs and dashboard share
- Rails AI Agents with the Anthropic SDK: Guardrails - agent runs are background jobs worth monitoring